环境,软件准备
本次演示环境,我是在虚拟机上安装 Linux 系统来执行操作,以下是安装的软件及版本:
- System: CentOS Linux release 7.6
- Docker: 24.0.5
- Prometheus: v2.37.6
- Consul: 1.6.1
docker 安装prometheus,alertmanage,说明一下这里直接将exporter,grafana等组件一起安装完成.
[root@node1-prome /zpf/k8s/prometheus/docker-prometheus]$cat docker-compose.yaml
version: '3.3'

volumes:
  prometheus_data: {}
  grafana_data: {}

networks:
  monitoring:
    driver: bridge

services:
  prometheus:
    image: prom/prometheus:v2.37.6
    container_name: prometheus
    restart: always
    volumes:
      - /etc/localtime:/etc/localtime:ro
      - ./prometheus/:/etc/prometheus/
      - prometheus_data:/prometheus
    command:
      - '--config.file=/etc/prometheus/prometheus.yml'
      - '--storage.tsdb.path=/prometheus'
      - '--web.console.libraries=/usr/share/prometheus/console_libraries'
      - '--web.console.templates=/usr/share/prometheus/consoles'
      #热加载配置
      - '--web.enable-lifecycle'
      #api配置
      #- '--web.enable-admin-api'
      #历史数据最大保留时间,默认15天
      - '--storage.tsdb.retention.time=30d'
    networks:
      - monitoring
    links:
      - alertmanager
      - cadvisor
      - node_exporter
    expose:
      - '9090'
    ports:
      - 9090:9090
    depends_on:
      - cadvisor

  alertmanager:
    image: prom/alertmanager:v0.25.0
    container_name: alertmanager
    restart: always
    volumes:
      - /etc/localtime:/etc/localtime:ro
      - ./alertmanager/:/etc/alertmanager/
    command:
      - '--config.file=/etc/alertmanager/config.yml'
      - '--storage.path=/alertmanager'
    networks:
      - monitoring
    expose:
      - '9093'
    ports:
      - 9093:9093

  cadvisor:
    image: google/cadvisor:latest
    container_name: cadvisor
    restart: always
    volumes:
      - /etc/localtime:/etc/localtime:ro
      - /:/rootfs:ro
      - /var/run:/var/run:rw
      - /sys:/sys:ro
      - /var/lib/docker/:/var/lib/docker:ro
    networks:
      - monitoring
    expose:
      - '8080'

  node_exporter:
    image: prom/node-exporter:v1.5.0
    container_name: node-exporter
    restart: always
    volumes:
      - /etc/localtime:/etc/localtime:ro
      - /proc:/host/proc:ro
      - /sys:/host/sys:ro
      - /:/rootfs:ro
    command:
      - '--path.procfs=/host/proc'
      - '--path.sysfs=/host/sys'
      - '--collector.filesystem.ignored-mount-points=^/(sys|proc|dev|host|etc|rootfs/var/lib/docker)($$|/)'
    networks:
      - monitoring
    ports:
      - '9100:9100'

  grafana:
    image: registry.cn-beijing.aliyuncs.com/scorpio/grafana-cn:v9.4.0
    container_name: grafana
    restart: always
    volumes:
      - /etc/localtime:/etc/localtime:ro
      - grafana_data:/var/lib/grafana
      - ./grafana/provisioning/:/etc/grafana/provisioning/
    env_file:
      - ./grafana/config.monitoring
    networks:
      - monitoring
    links:
      - prometheus
    ports:
      - 3000:3000
    depends_on:
      - prometheus
docker-compose中将部分容器的配置文件目录映射到了宿主机上做了持久化.方便修改配置项.
创建prometheus配置文件.*这里rule_files:下面的事报警触发器配置.可以是单个文件.也可以是整个目录.生产环境中可能会有多个目录进行报警的触发配置.
[root@node1-prome /zpf/k8s/prometheus/docker-prometheus/prometheus]$cat prometheus.yml
# 全局配置
global:
  scrape_interval:     15s # 将搜刮间隔设置为每15秒一次。默认是每1分钟一次。
  evaluation_interval: 15s # 每15秒评估一次规则。默认是每1分钟一次。

# Alertmanager 配置
alerting:
  alertmanagers:
  - static_configs:
    - targets: ['alertmanager:9093']

# 报警(触发器)配置
rule_files:
  - "alert.yml"
  - "rules/*.yml"

# 搜刮配置
scrape_configs:
  - job_name: 'prometheus'
    # 覆盖全局默认值,每15秒从该作业中刮取一次目标
    scrape_interval: 15s
    static_configs:
    - targets: ['192.168.75.41:9090']
  - job_name: 'alertmanager'
    # 覆盖全局默认值,每15秒从该作业中刮取一次目标
    scrape_interval: 15s
    static_configs:
    - targets: ['alertmanager:9093']

  - job_name: 'node-exporter'
    consul_sd_configs:
      - server: '192.168.75.41:8500'
        services: []
    relabel_configs:
      - source_labels: [__meta_consul_tags]
        regex: .*node-exporter.*
        action: keep
      - regex: __meta_consul_service_metadata_(.+)
        action: labelmap
创建node-exporter的监控项信息,
说明一下.为了后面的报警触发,这里将没存利用率设置为只要内存可用率大于10就触发报警.(其实就是node-exporter中的一堆监控项的运算组合.)最后达到预期的阈值就会进行报警.
[root@node1-prome /zpf/k8s/prometheus/docker-prometheus/prometheus]$cat alert.yml
groups:
- name: node-exporter
  rules:
  - alert: HostOutOfMemory
#    expr: node_memory_MemAvailable_bytes / node_memory_MemTotal_bytes * 100 < 10
    expr: node_memory_MemAvailable_bytes / node_memory_MemTotal_bytes * 100 > 10
    for: 1m
    labels:
      severity: warning
    annotations:
      summary: "主机内存不足,实例:{{ $labels.instance }}"
#      description: "内存可用率<10%,当前值:{{ $value }}"
      description: "内存可用率>10%,当前值:{{ $value }}"
  - alert: HostMemoryUnderMemoryPressure
    expr: rate(node_vmstat_pgmajfault[1m]) > 1000
    for: 2m
    labels:
      severity: warning
    annotations:
      summary: "内存压力不足,实例:{{ $labels.instance }}"
      description: "节点内存压力大。 重大页面错误率高,当前值为:{{ $value }}"
  - alert: HostUnusualNetworkThroughputIn
    expr: sum by (instance) (rate(node_network_receive_bytes_total[2m])) / 1024 / 1024 > 100
    for: 5m
    labels:
      severity: warning
    annotations:
      summary: "异常流入网络吞吐量,实例:{{ $labels.instance }}"
      description: "网络流入流量 > 100 MB/s,当前值:{{ $value }}"
  - alert: HostUnusualNetworkThroughputOut
    expr: sum by (instance) (rate(node_network_transmit_bytes_total[2m])) / 1024 / 1024 > 100
    for: 5m
    labels:
      severity: warning
    annotations:
      summary: "异常流出网络吞吐量,实例:{{ $labels.instance }}"
      description: "网络流出流量 > 100 MB/s,当前值为:{{ $value }}"
  - alert: HostUnusualDiskReadRate
    expr: sum by (instance) (rate(node_disk_read_bytes_total[2m])) / 1024 / 1024 > 50
    for: 5m
    labels:
      severity: warning
    annotations:
      summary: "异常磁盘读取,实例:{{ $labels.instance }}"
      description: "磁盘读取> 50 MB/s,当前值:{{ $value }}"
  - alert: HostUnusualDiskWriteRate
    expr: sum by (instance) (rate(node_disk_written_bytes_total[2m])) / 1024 / 1024 > 50
    for: 2m
    labels:
      severity: warning
    annotations:
      summary: "异常磁盘写入,实例:{{ $labels.instance }}"
      description: "磁盘写入> 50 MB/s,当前值:{{ $value }}"
  - alert: HostOutOfDiskSpace
    expr: (node_filesystem_avail_bytes * 100) / node_filesystem_size_bytes < 10 and ON (instance, device, mountpoint) node_filesystem_readonly == 0
    for: 2m
    labels:
      severity: warning
    annotations:
      summary: "磁盘空间不足告警,实例:{{ $labels.instance }}"
      description: "剩余磁盘空间< 10% ,当前值:{{ $value }}"
  - alert: HostDiskWillFillIn24Hours
    expr: (node_filesystem_avail_bytes * 100) / node_filesystem_size_bytes < 10 and ON (instance, device, mountpoint) predict_linear(node_filesystem_avail_bytes{fstype!~"tmpfs"}[1h], 24 * 3600) < 0 and ON (instance, device, mountpoint) node_filesystem_readonly == 0
    for: 2m
    labels:
      severity: warning
    annotations:
      summary: "磁盘空间将在24小时内耗尽,实例:{{ $labels.instance }}"
      description: "以当前写入速率预计磁盘空间将在 24 小时内耗尽,当前值:{{ $value }}"
  - alert: HostOutOfInodes
    expr: node_filesystem_files_free{mountpoint ="/"} / node_filesystem_files{mountpoint="/"} * 100 < 10 and ON (instance, device, mountpoint) node_filesystem_readonly{mountpoint="/"} == 0
    for: 2m
    labels:
      severity: warning
    annotations:
      summary: "磁盘Inodes不足,实例:{{ $labels.instance }}"
      description: "剩余磁盘 inodes < 10%,当前值: {{ $value }}"
  - alert: HostUnusualDiskReadLatency
    expr: rate(node_disk_read_time_seconds_total[1m]) / rate(node_disk_reads_completed_total[1m]) > 0.1 and rate(node_disk_reads_completed_total[1m]) > 0
    for: 2m
    labels:
      severity: warning
    annotations:
      summary: "异常磁盘读取延迟,实例:{{ $labels.instance }}"
      description: "磁盘读取延迟 > 100ms,当前值:{{ $value }}"
  - alert: HostUnusualDiskWriteLatency
    expr: rate(node_disk_write_time_seconds_total[1m]) / rate(node_disk_writes_completed_total[1m]) > 0.1 and rate(node_disk_writes_completed_total[1m]) > 0
    for: 2m
    labels:
      severity: warning
    annotations:
      summary: "异常磁盘写入延迟,实例:{{ $labels.instance }}"
      description: "磁盘写入延迟 > 100ms,当前值:{{ $value }}"
  - alert: high_load
    expr: node_load1 > 4
    for: 2m
    labels:
      severity: page
    annotations:
      summary: "CPU1分钟负载过高,实例:{{ $labels.instance }}"
      description: "CPU1分钟负载>4,已经持续2分钟。当前值为:{{ $value }}"
  - alert: HostCpuIsUnderUtilized
    expr: 100 - (avg by(instance) (rate(node_cpu_seconds_total{mode="idle"}[2m])) * 100) > 80
    for: 1m
    labels:
      severity: warning
    annotations:
      summary: "cpu负载高,实例:{{ $labels.instance }}"
      description: "cpu负载> 80%,当前值:{{ $value }}"
  - alert: HostCpuStealNoisyNeighbor
    expr: avg by(instance) (rate(node_cpu_seconds_total{mode="steal"}[5m])) * 100 > 10
    for: 0m
    labels:
      severity: warning
    annotations:
      summary: "CPU窃取率异常,实例:{{ $labels.instance }}"
      description: "CPU 窃取率 > 10%。 嘈杂的邻居正在扼杀 VM 性能,或者 Spot 实例可能失去信用,当前值:{{ $value }}"
  - alert: HostSwapIsFillingUp
    expr: (1 - (node_memory_SwapFree_bytes / node_memory_SwapTotal_bytes)) * 100 > 80
    for: 2m
    labels:
      severity: warning
    annotations:
      summary: "磁盘swap空间使用率异常,实例:{{ $labels.instance }}"
      description: "磁盘swap空间使用率>80%"
  - alert: HostNetworkReceiveErrors
    expr: rate(node_network_receive_errs_total[2m]) / rate(node_network_receive_packets_total[2m]) > 0.01
    for: 2m
    labels:
      severity: warning
    annotations:
      summary: "异常网络接收错误,实例:{{ $labels.instance }}"
      description: "网卡{{ $labels.device }}在过去2分钟接收错误率大于0.01,当前值:{{ $value }}"
  - alert: HostNetworkTransmitErrors
    expr: rate(node_network_transmit_errs_total[2m]) / rate(node_network_transmit_packets_total[2m]) > 0.01
    for: 2m
    labels:
      severity: warning
    annotations:
      summary: "异常网络传输错误,实例:{{ $labels.instance }}"
      description: "网卡{{ $labels.device }}在过去2分钟传输错误率大于0.01,当前值:{{ $value }}"
  - alert: HostNetworkInterfaceSaturated
    expr: (rate(node_network_receive_bytes_total{device!~"^tap.*"}[1m]) + rate(node_network_transmit_bytes_total{device!~"^tap.*"}[1m])) / node_network_speed_bytes{device!~"^tap.*"} > 0.8 < 10000
    for: 1m
    labels:
      severity: warning
    annotations:
      summary: "异常网络接口饱和,实例:{{ $labels.instance }}"
      description: "网卡{{ $labels.device }}正在超载,当前值{{ $value }}"
  - alert: HostConntrackLimit
    expr: node_nf_conntrack_entries / node_nf_conntrack_entries_limit > 0.8
    for: 5m
    labels:
      severity: warning
    annotations:
      summary: "异常连接数,实例:{{ $labels.instance }}"
      description: "连接数过大,当前连接数:{{ $value }}"
  - alert: HostClockSkew
    expr: (node_timex_offset_seconds > 0.05 and deriv(node_timex_offset_seconds[5m]) >= 0) or (node_timex_offset_seconds < -0.05 and deriv(node_timex_offset_seconds[5m]) <= 0)
    for: 2m
    labels:
      severity: warning
    annotations:
      summary: "异常时钟偏差,实例:{{ $labels.instance }}"
      description: "检测到时钟偏差,时钟不同步。值为:{{ $value }}"
  - alert: HostClockNotSynchronising
    expr: min_over_time(node_timex_sync_status[1m]) == 0 and node_timex_maxerror_seconds >= 16
    for: 2m
    labels:
      severity: warning
    annotations:
      summary: "时钟不同步,实例:{{ $labels.instance }}"
      description: "时钟不同步"
  - alert: NodeFileDescriptorLimit
    expr: node_filefd_allocated / node_filefd_maximum * 100 > 80
    for: 1m
    labels:
      severity: warning
    annotations:
      summary: "预计内核将很快耗尽文件描述符限制"
      description: "{{ $labels.instance }}}已分配的文件描述符数超过了限制的80%,当前值为:{{ $value }}"
配置alertmanage的全局报警配置信息.
[root@node1-prome /zpf/k8s/prometheus/docker-prometheus/alertmanager]$cat config.yml
global:
  #163服务器
  smtp_smarthost: 'smtp.qq.com:465'
  #发邮件的邮箱
  smtp_from: 'xxxx@qq.com'
  #发邮件的邮箱用户名,也就是你的邮箱
  smtp_auth_username: 'xxxx@qq.com'
  #发邮件的邮箱密码(注意一下这里并不是你qq账号的密码,而是邮箱生产的一个第三方登陆的密码.一般来说可能是十几位的组合形式.具体方法自行查找相关文档
  smtp_auth_password: 'asdalsdjlk'
  #进行tls验证
  smtp_require_tls: false

route:
  group_by: ['warn']
  # 当收到告警的时候,等待group_wait配置的时间,看是否还有告警,如果有就一起发出去
  group_wait: 10s
  #  如果上次告警信息发送成功,此时又来了一个新的告警数据,则需要等待group_interval配置的时间才可以发送出去
  group_interval: 10s
  # 如果上次告警信息发送成功,且问题没有解决,则等待 repeat_interval配置的时间再次发送告警数据
  repeat_interval: 10m
  # 全局报警组,这个参数是必选的,意思就是上面是发件人以及告警服务器相关信息,下面是接收人相关信息.
  receiver: email

receivers:
- name: 'email'  #报警组名称
  #收邮件的邮箱
  email_configs:
  - to: 'xxxxxx@163.com'  #收件邮箱
inhibit_rules:
 - source_match:  #表示抑制规则的定义.原匹配条件.
     severity: 'critical'  #事件级别是紧急
   target_match: #
     severity: 'warning' #事件严重性
   equal: ['alertname', 'dev', 'instance']  #匹配规则.
当告警的源匹配条件中的严重性级别为'critical',并且目标匹配条件中的严重性级别为'warning',同时源匹配条件和目标匹配条件的标签值都相等时,该告警将被抑制.不是太明白为啥会有两个级别.得再研究研究.
重启alertmanager加载配置信息(一般我会重启服务来让配置重新加载.)
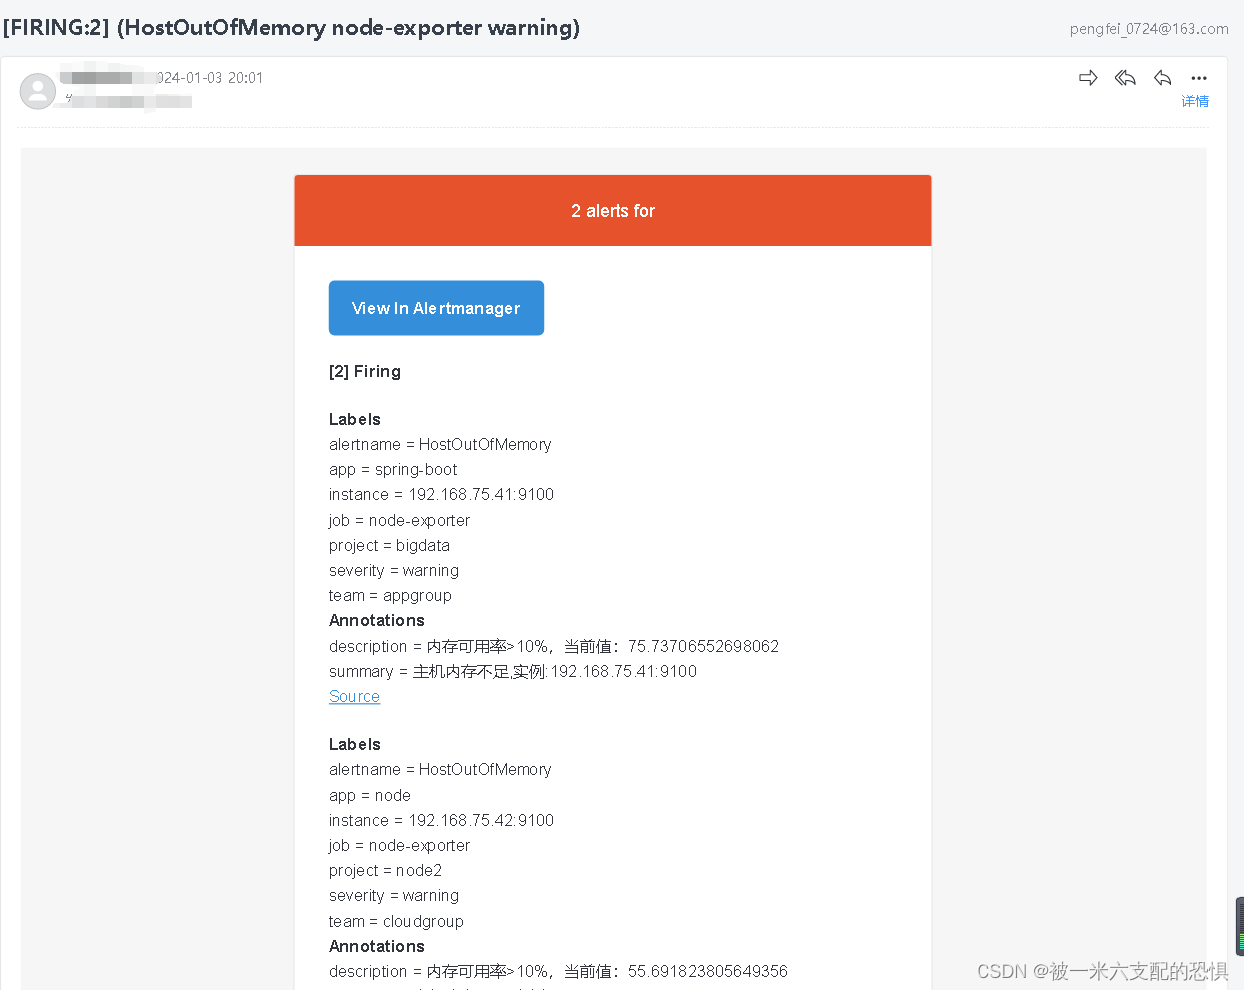
等待告警邮件发送,
查看告警信息